QGIS plugin for TEM data
Last modification on
Install via the QGIS Plugin Manager.
If you run into problems installing or using the plugin, please get in touch.
Release 0.1.5 — 3D Map View
Version 0.1.5 adds support for the QGIS 3D Map View. Imported soundings and resistivity layers are rendered as true 3D objects, making it straightforward to inspect fence diagrams and depth-of-investigation boundaries in three dimensions alongside other 3D datasets.
Motivation
The Transient Electromagnetic Method (TEM) is used for imaging subsurface electrical properties from the ground surface or with airborne instrumentation. The method is popular in ground-water surveys, mineral exploration, and other geological applications where differences in electrical resistivity of the subsurface are of interest.
The subsurface resistivities are calculated through numerical inversion, where the observed decay of an induced magnetic field is matched against subsurface properties. The inverted resistivity models are the end goal for the geological analysis, and are typically exported from the inversion software as XYZ text files. The files contain one row per sounding, with a stack of resistivity layers and a depth of investigation. Reading these data usually requires specialized commercial software.
TEM Loader is a QGIS plugin that does the import to QGIS. I made it for teaching activities under the Danish Strategic Sector Cooperation program, where we collaborate with geological surveys and water authorities in african countries on geophysics and geological modelling.
What it does
The plugin reads inversion XYZ files exported from TEMImage and Aarhus Workbench. For each file it creates three layers in a group:
- Points: surface positions of each sounding.
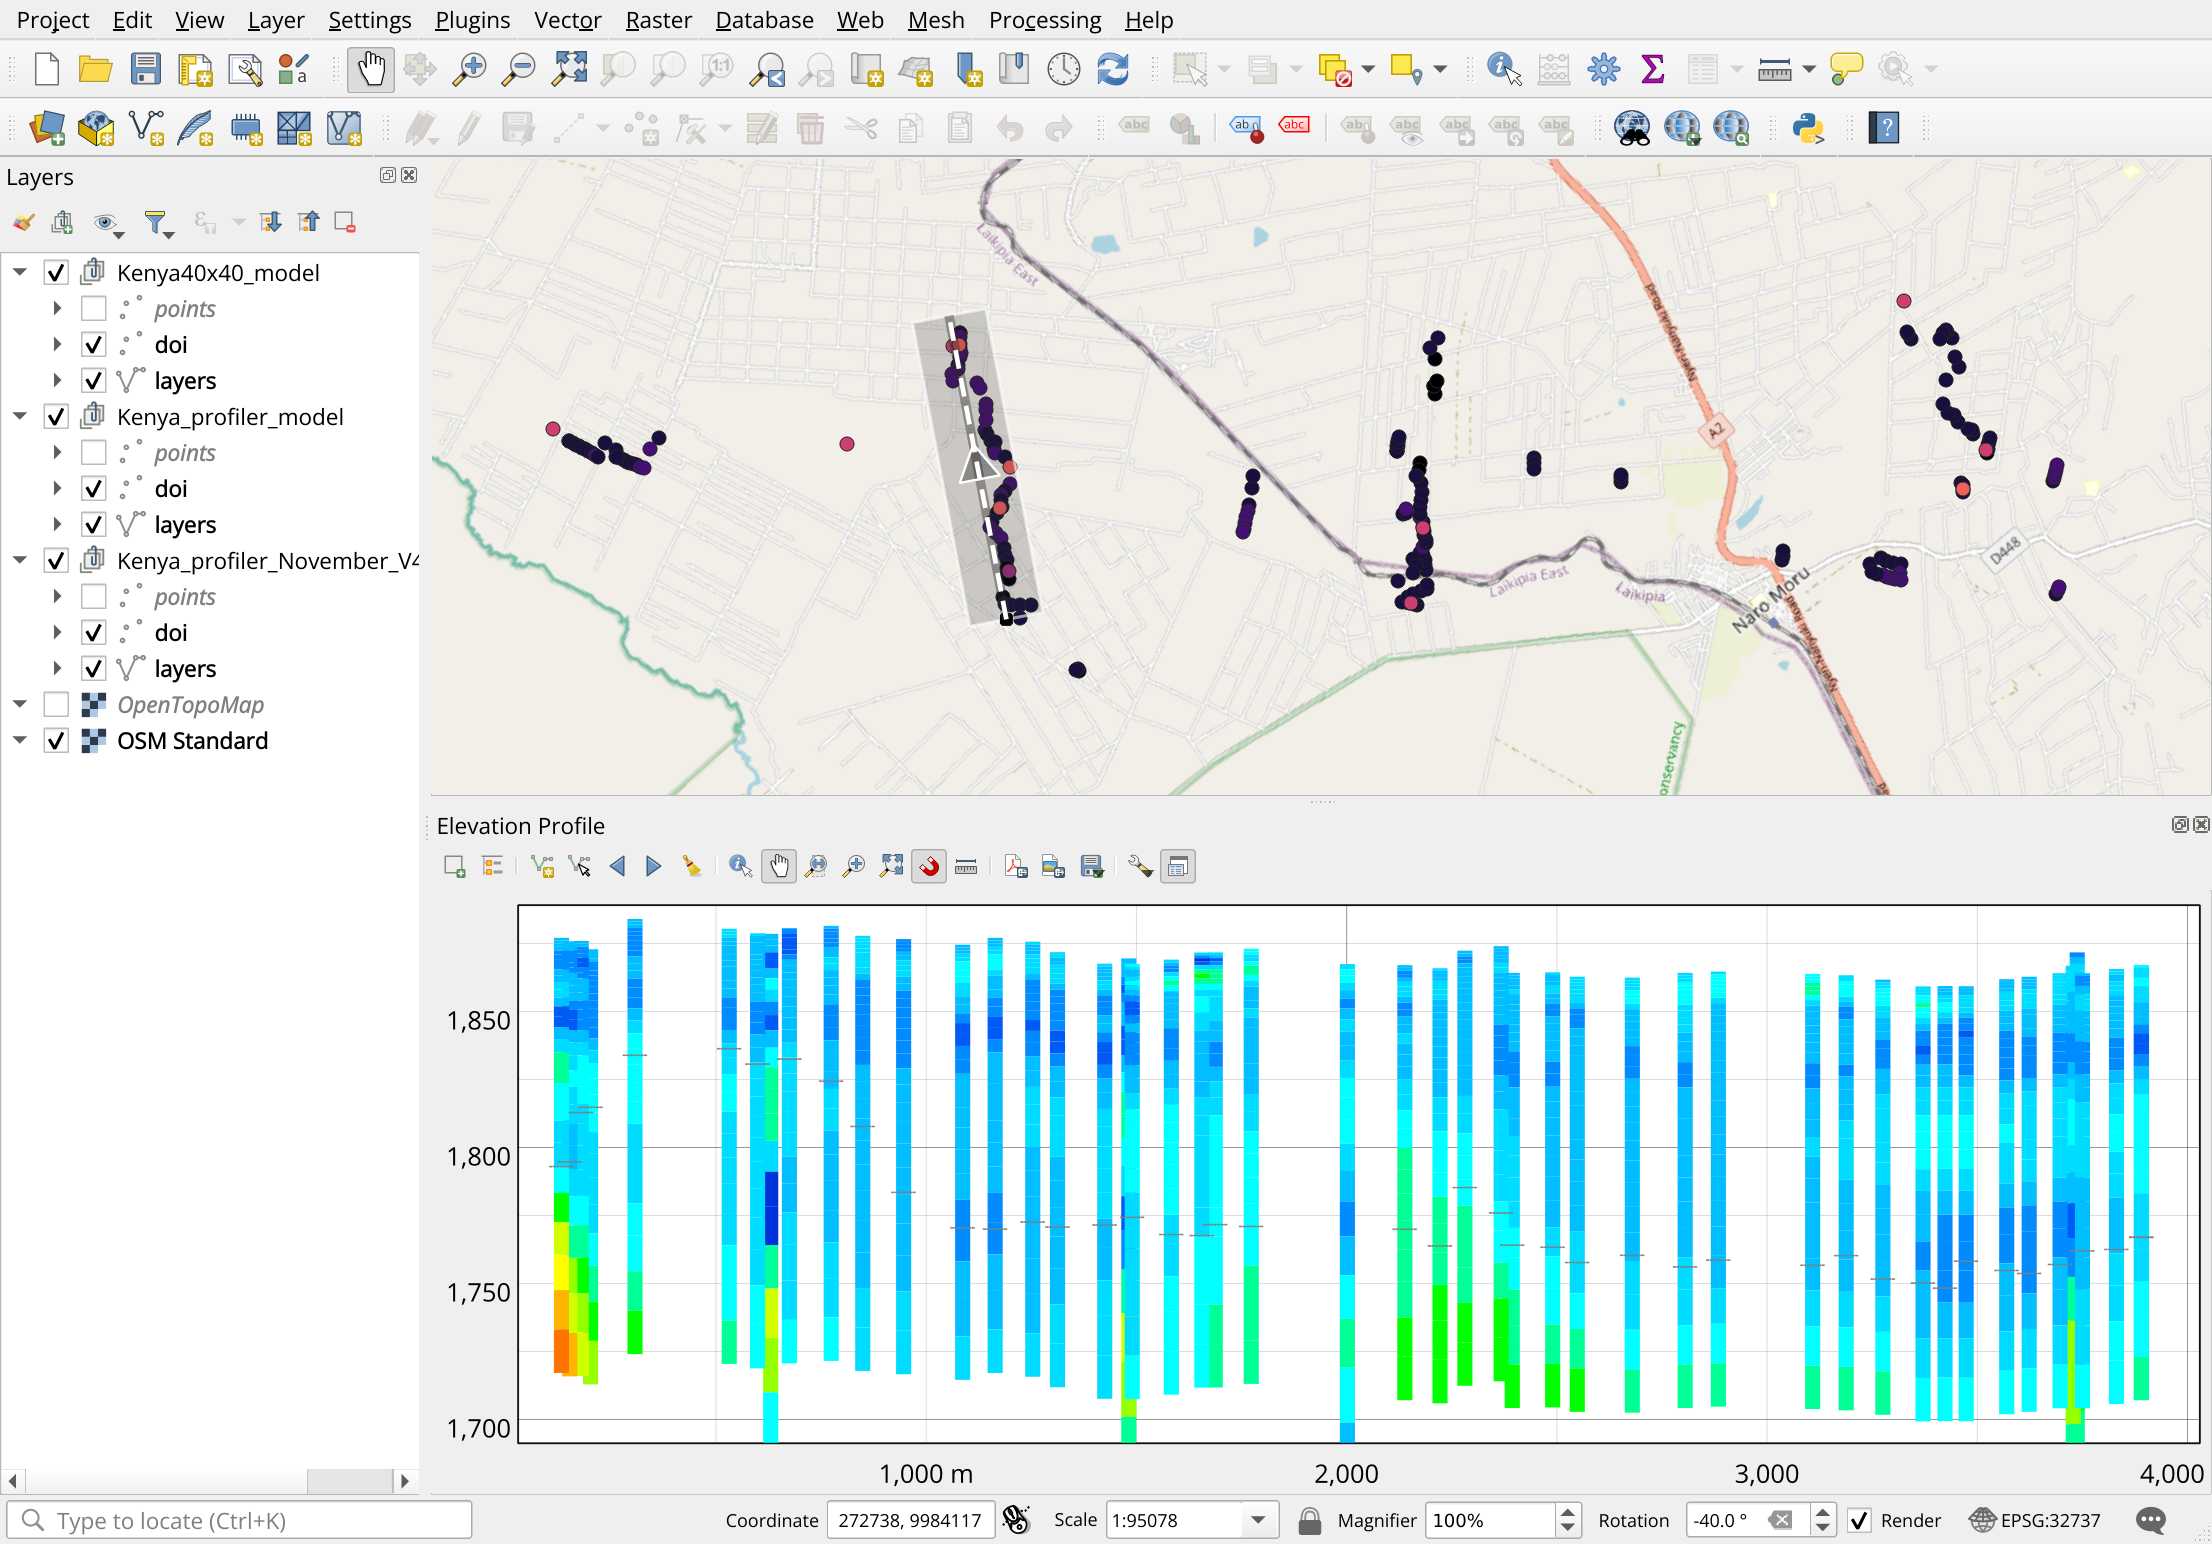
- DOI: depth-of-investigation points, revealing the lower confidence boundary in the model.
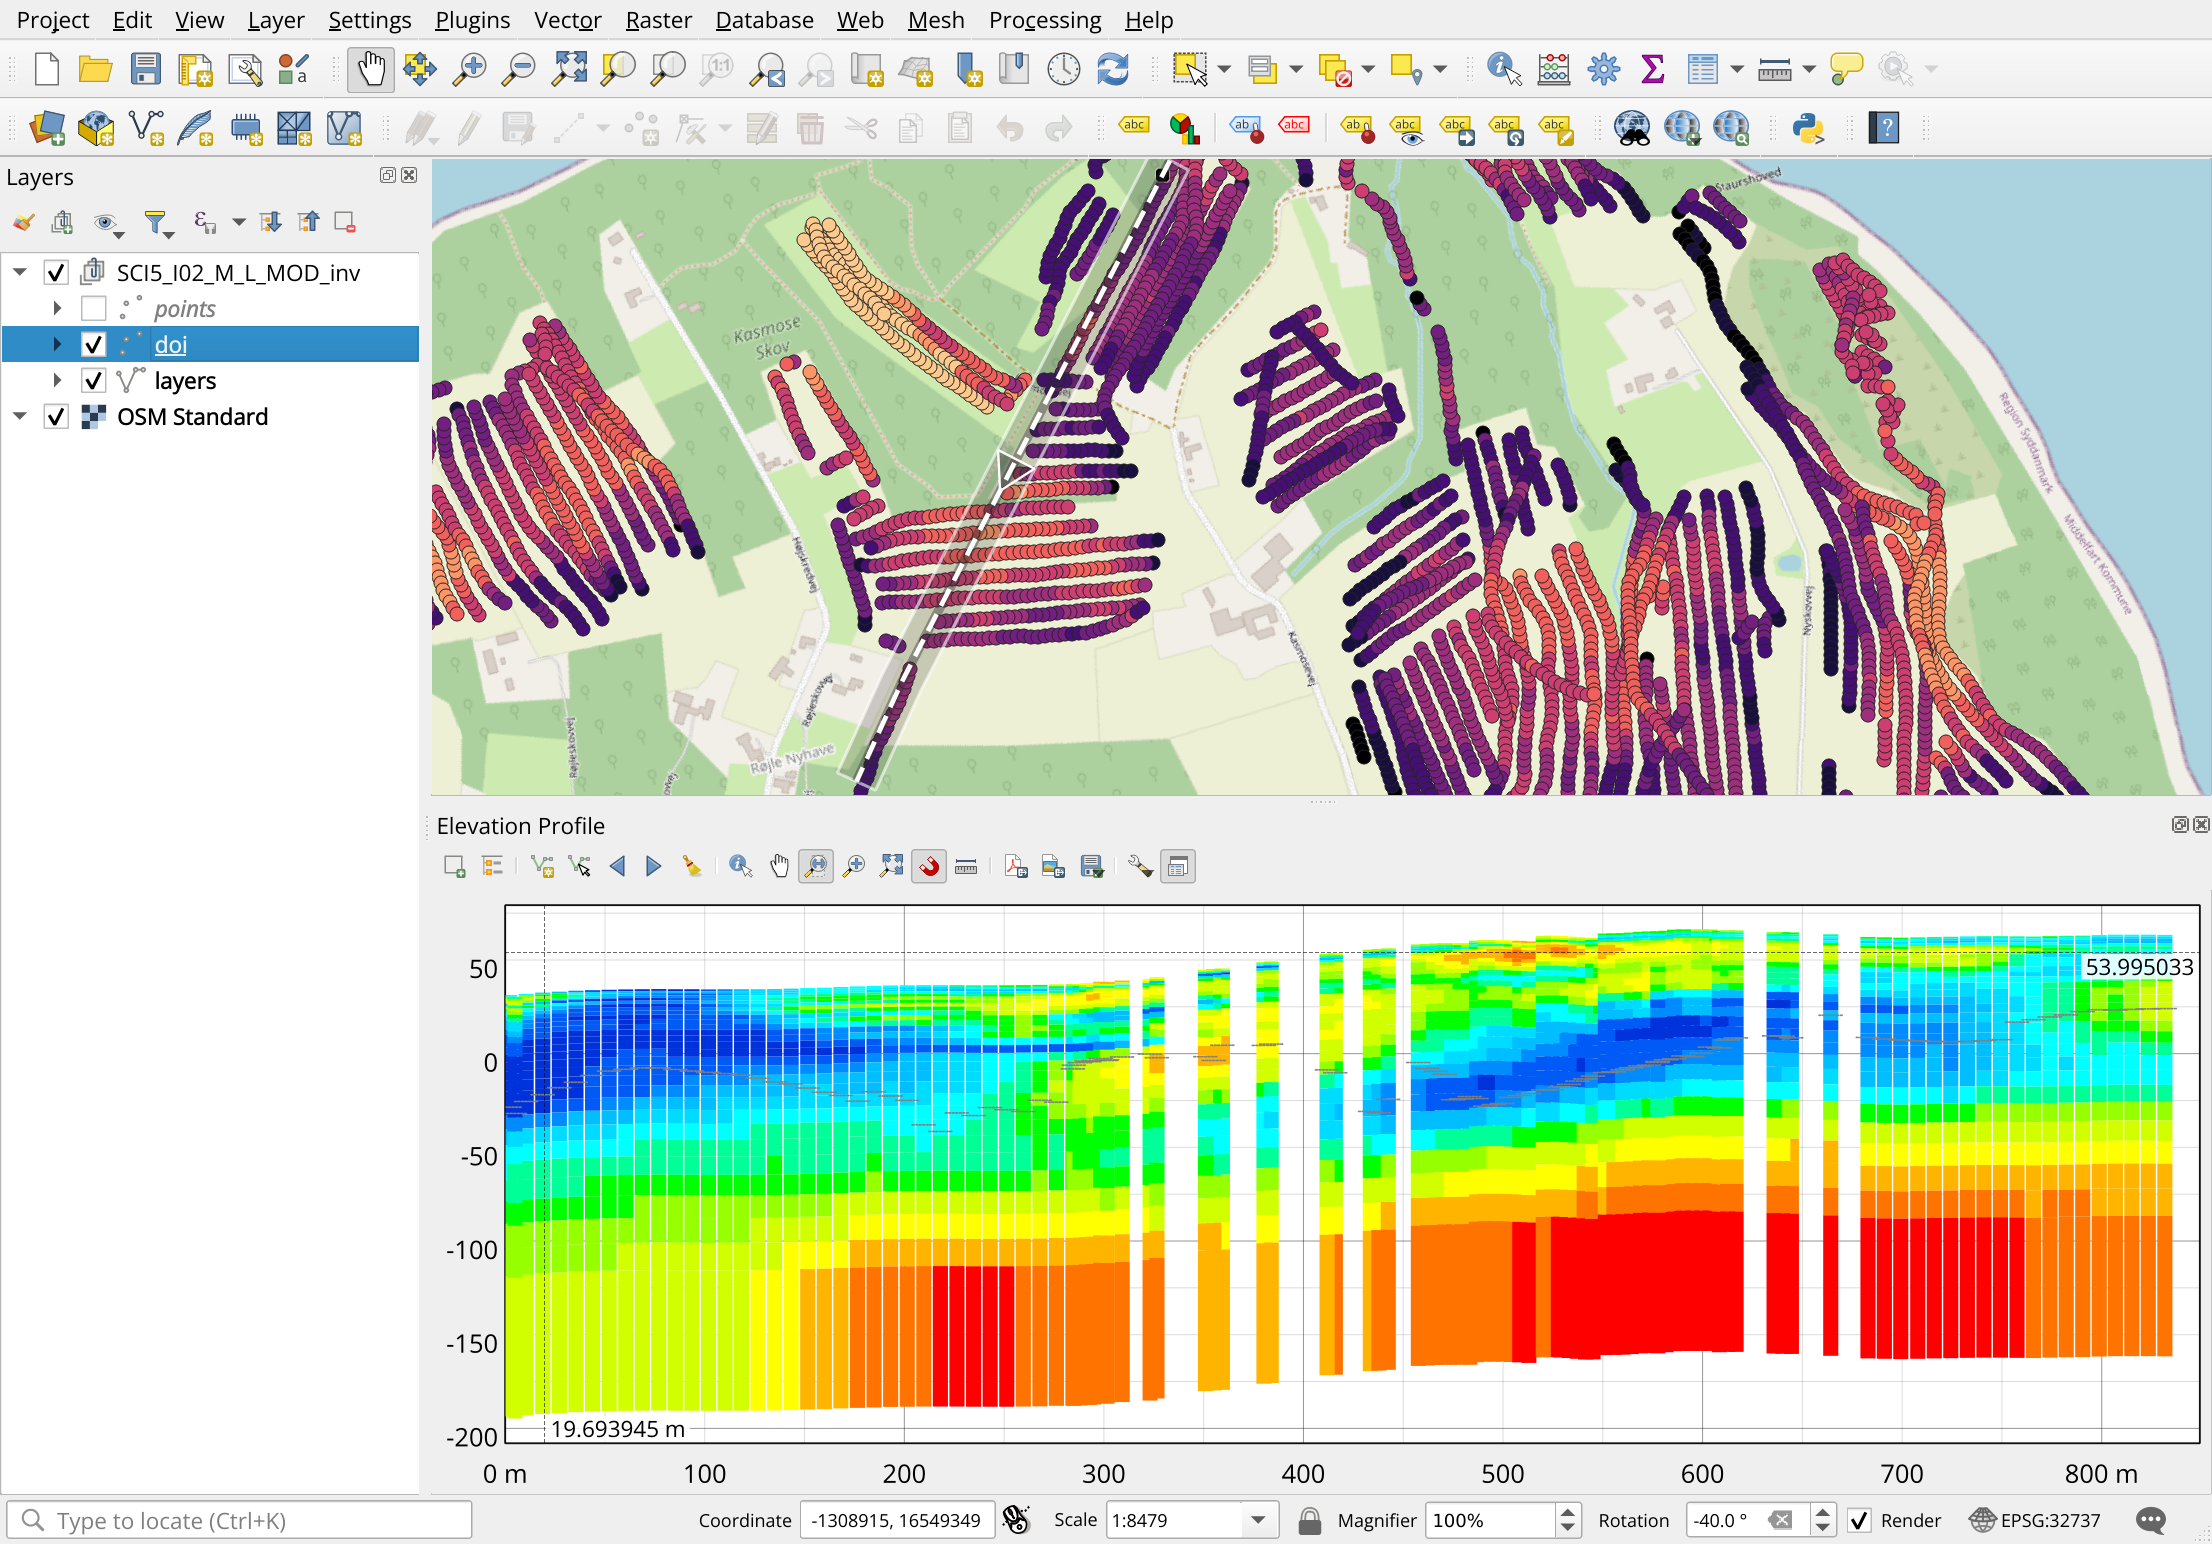
- Layers: resistivity layers as vertical 3D line segments.
These layers are styled with bundled QML files. The imported geometries are visible in the QGIS 3D Map viewer and Elevation Profile tool, where it is possible to draw cross-sections along any line.
If the XYZ header declares an EPSG code, it is used. Otherwise the loader falls back to the project CRS, and then to EPSG:4326. Three CSV files (filename.points.csv, filename.doi.csv, filename.layers.csv) are written next to the source file.
How the data becomes geometry
The parser is a small core.py module with no QGIS dependency, which keeps it unit-testable. TEMImage and Aarhus Workbench headers are normalised into a common schema.
Geometry is written as WKT strings into the CSVs and parsed by QGIS on load. For a sounding at (x, y) with surface elevation z and depth of investigation doi:
z_doi = z - doi
point_wkt = f'POINT Z ({x} {y} {z})'
doi_wkt   = f'POINT Z ({x} {y} {z_doi})'
Each resistivity layer is emitted as a vertical LINESTRING Z between the top and bottom elevations of that layer:
z_top = z - depth_top
z_bot = z - depth_bottom
layer_wkt = f'LINESTRING Z ({x} {y} {z_top}, {x} {y} {z_bot})'
For TEMImager data the depths are accumulated from the Thick_* columns. For Aarhus Workbench data the explicit DEP_TOP_* and DEP_BOT_* columns are used when present. Rendered side by side along a survey line, the stacked line segments form a fence diagram coloured by resistivity.
TEM Loader targets QGIS 3.40 or later, and works on Windows, MacOS, and Linux.
Source and issue tracker: gitlab.com/qgeomodel/qgis-tem-loader.
If something does not work, or the loader rejects a file it should handle, please send me an email.